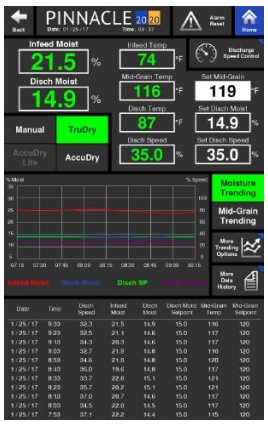
Monitor Page
Discharge Information
The Monitor Page is the third of the three Operation pages. The Monitor page is divided into thirds. The top third contains quantitative values that can either be read or adjusted. The operator can also change between discharge modes from here. However, it is important to note that when changing between TruDry and AccuDry, the operator must change to Manual mode first before changing to TruDry or AccuDry.
Another area where the operator can change discharge modes and make adjustments to the discharge settings is in the Discharge Speed Control quick launch. More on the contents within the Discharge Speed Control page can be viewed in the associated section.

Trending Graphs
In the middle of the Monitor page a quick view of different trending graphs is displayed. The graph shows up to 2 hours of recorded data. The operator can choose which trending graph to display on the Monitor page by selecting either the Moisture Trending button or Mid-Grain Trending button. Selecting these buttons will cause the display to toggle between these two graphs. The button highlighted in green indicates the graph that is currently being displayed on the Monitor page.
If more information about the trending graphs is desired, the operator can quickly access it by simply pressing the "More Trending Options" button. This quick launch contains larger graphs, with more information which is further explained in the Trending section of this manual.
Running Data
The bottom third of the Monitor page is where a table containing historical running data is displayed. The data displayed is grouped into rows that correspond to a date and time at which those values were recorded. A row of data is recorded every 10 minutes, spanning a total of two hours. The data that makes up this two hour graph is collected whether the dryer is discharging or not. More data can be accessed by pressing the More Data History quick launch button. Additional explanation can be found in the Data Logging History section.
Last updated
