Trending
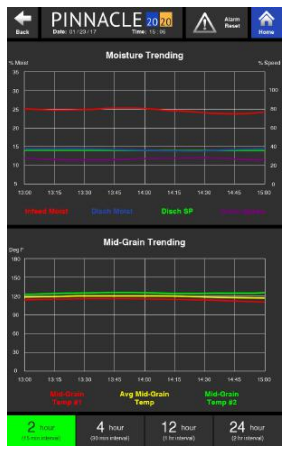
The third of the four options under Historical Data is Trending. By selecting Trending, the operator will be taken to a page containing Moisture and Mid-Grain trending graphs.

As previously mentioned, the trends displayed on the Monitor page are limited to 2-hour intervals. However, if the "More Trending Options" button located on the Monitor page is pressed, the operator is taken to this Trending page where the trends are displayed on a larger scale. Also, the Trending page allows for the two trending graphs to be displayed at 4 different time intervals. These time interval options are at the bottom of the Trending page and pressing them toggles the two graphs between 2-, 4-, 12- and 24-hour increments.
For convenience, the Mid-Grain Trending graph is directly below the Moisture Trending graph. These two graphs are in-line with each other, allowing the x-axis of both trends to be in sync. This makes it easy to read both the moistures and Mid-Grain temperatures at a given time since the time is plotted on the x-axis.
